Tools used: Figma, FigJam, Mobbin, iPad / Project's Year: 2023
Redesigning an ERP experience to match a luxury furniture brand
The project aimed to develop an ERP interface catering to two pivotal roles: Analysts and Reporting Managers.
To achieve this, we crafted a Design System aligned with the brand's style guide, ensuring seamless integration of high-fidelity prototypes and addressing the specific component needs for the two user flows.
To achieve this, we crafted a Design System aligned with the brand's style guide, ensuring seamless integration of high-fidelity prototypes and addressing the specific component needs for the two user flows.
Design Challenge
Bridging elegance and technical limitations
The challenge with this client was the following: How can we redesign an ERP platform to balance the modern look and feel of an established luxury furniture brand, but at the same time strictly adhere to the foundational framework of the software company?
Technical Framework
Working within existing software architecture constraints
Brand Identity
Maintaining luxury furniture brand aesthetics
Before
Legacy ERP System
After
Elegant UI, Same Framework
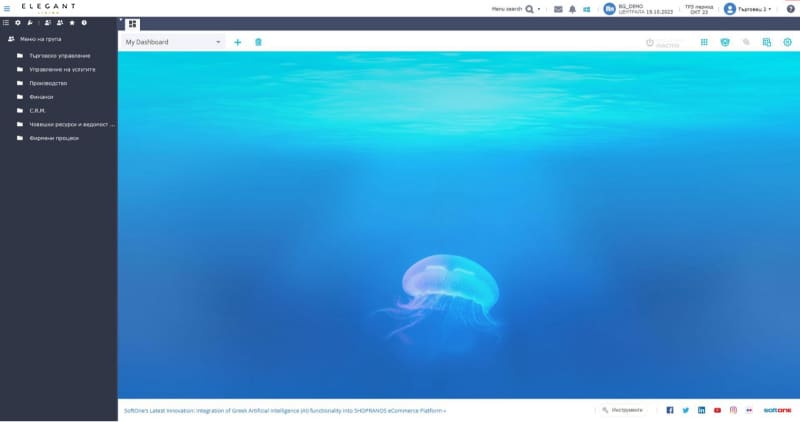
A screenshot of the legacy ERP System
Establishing goals
Following an in-depth client workshop to comprehend their unique needs and goals, we established four key criteria that would serve as benchmarks to measure the success of this project.
Data-driven UI
Develop a user interface grounded in data-driven UI best practices to enhance user experience and usability.
Customisation
Enable rich customisation options to meet the unique preferences and needs of individual users.
User freedom
Prioritise user autonomy, providing them with the freedom to personalise their experience within the system.
Holistic system
Design a comprehensive system that caters to the requirements of multiple user roles, ensuring seamless functionality and integration across the board.
User Workshops - Determining Strategy
After a series of workshops with the luxury furniture brand, delving into the intricacies of their users' needs and ERP requirements. This allowed us to plan and prepare for the functional scope, essential for a seamless integration. After that, while our UX team engaged in ideating and conceptualizing the main user flows and information architecture, our UI team simultaneously crafted a design system as a response to the scope.
With both aspects completed, the moment arrived to harmoniously merge these elements into an elegant internal experience that would not only meet user needs but also reflect the brand's distinctive aesthetic seamlessly.
With both aspects completed, the moment arrived to harmoniously merge these elements into an elegant internal experience that would not only meet user needs but also reflect the brand's distinctive aesthetic seamlessly.
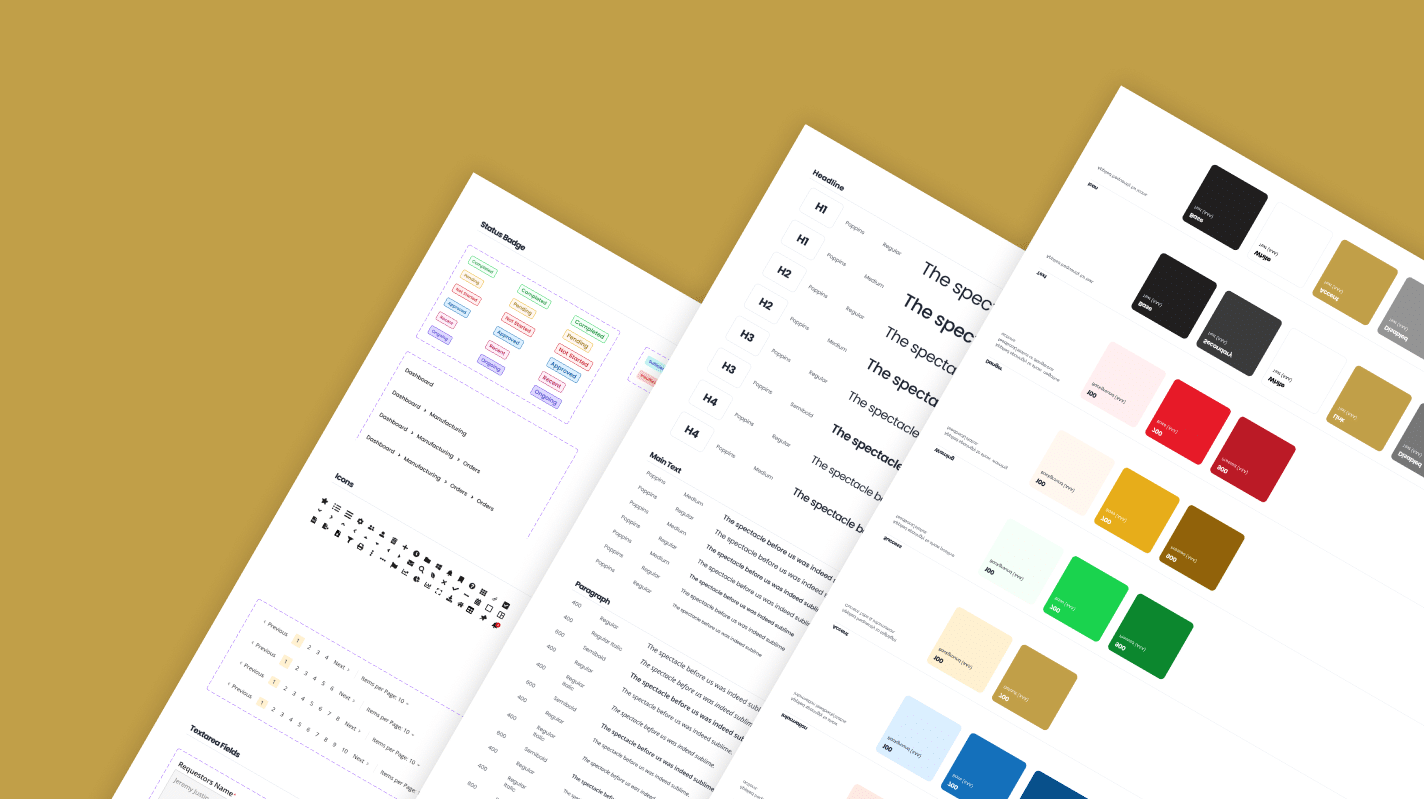
The Design System, which was developed for the needs of the project.
Ideation and Conceptualisation
Persona
User #1: Analyst 👩💼
Goals:
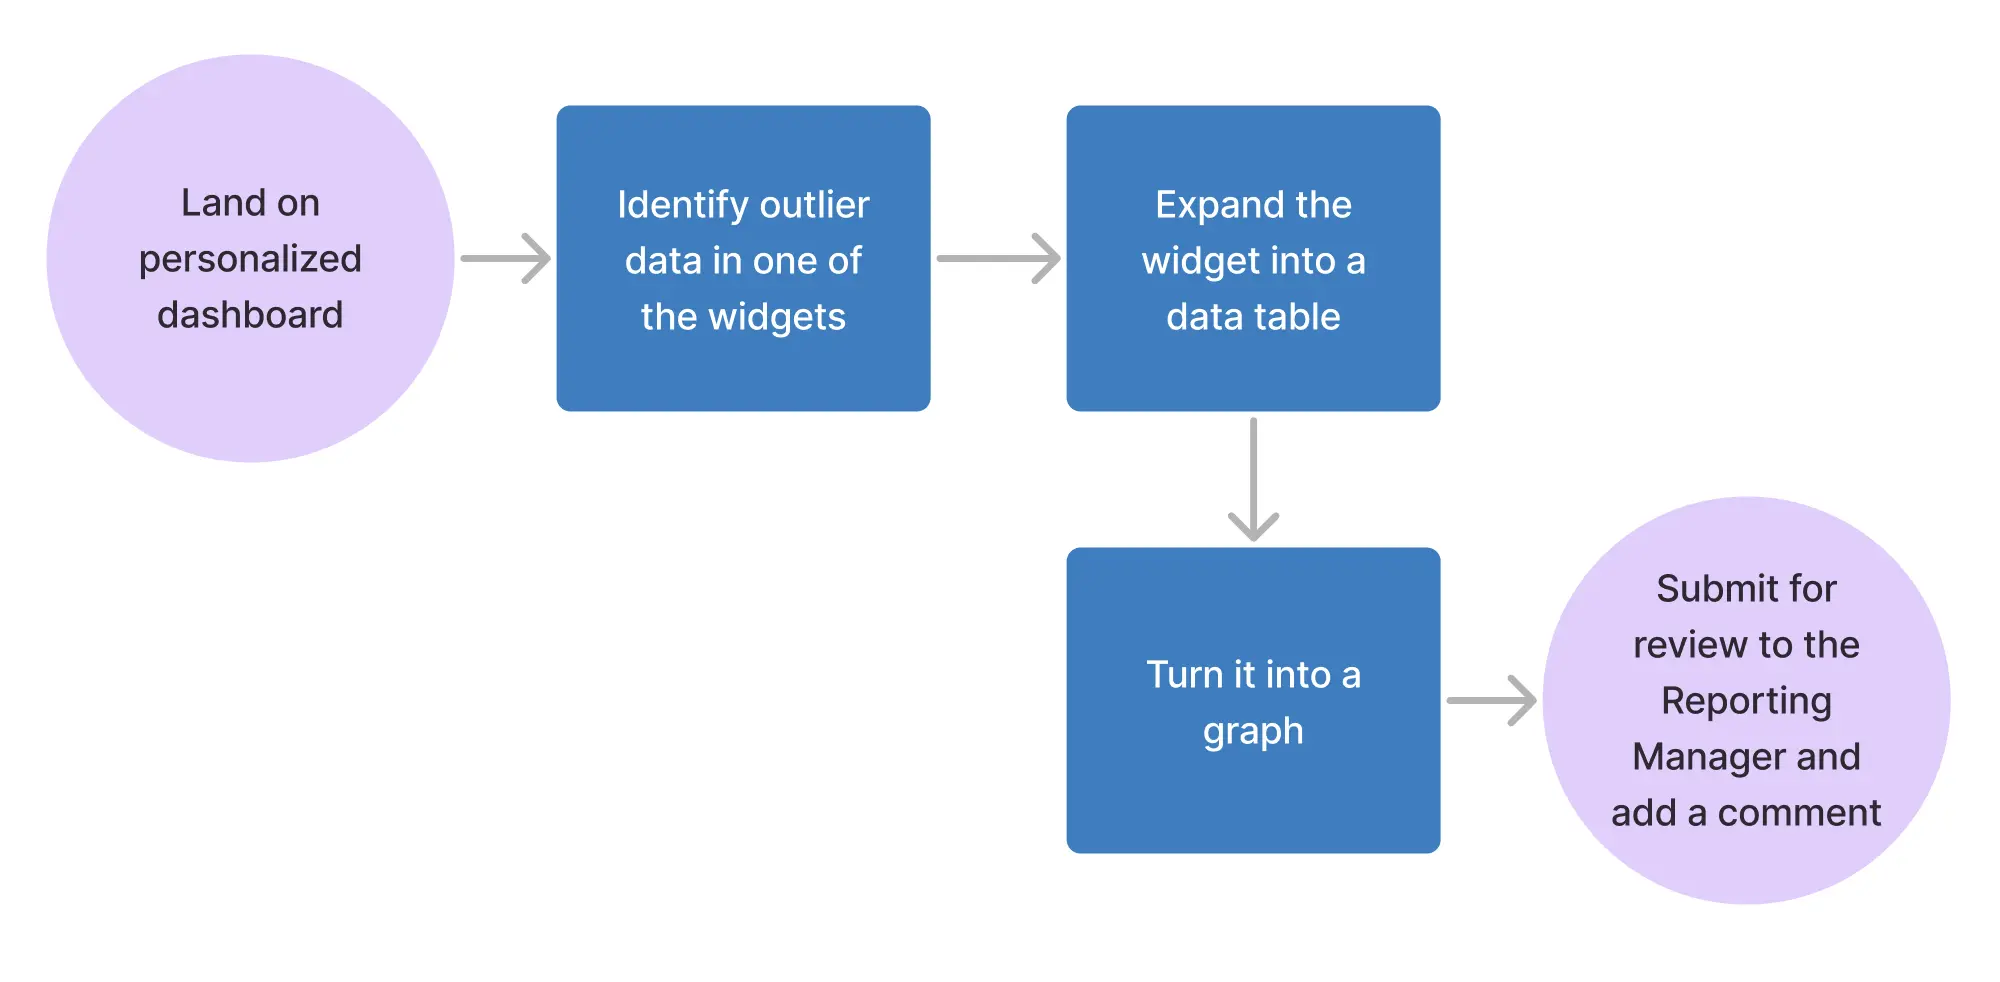
• Conduct in-depth data analysis to identify outliers in sales and inventory.
• Create reports to support strategic decisions, especially in optimizing inventory levels and supplier relationships.
• Collaborate with the Reporting Manager to provide actionable insights based on data analysis.
• Create reports to support strategic decisions, especially in optimizing inventory levels and supplier relationships.
• Collaborate with the Reporting Manager to provide actionable insights based on data analysis.
Challenges:
• Requires access to a variety of data sources to perform in-depth analysis.
• Needs tools for data visualization and analytics.
• Must be able to create ad-hoc reports to address specific analysis requirements.
• Needs tools for data visualization and analytics.
• Must be able to create ad-hoc reports to address specific analysis requirements.
Persona
User #2: Reporting Manager 👨💼
Goals:
• Monitor the overall health of the business through critical KPIs.
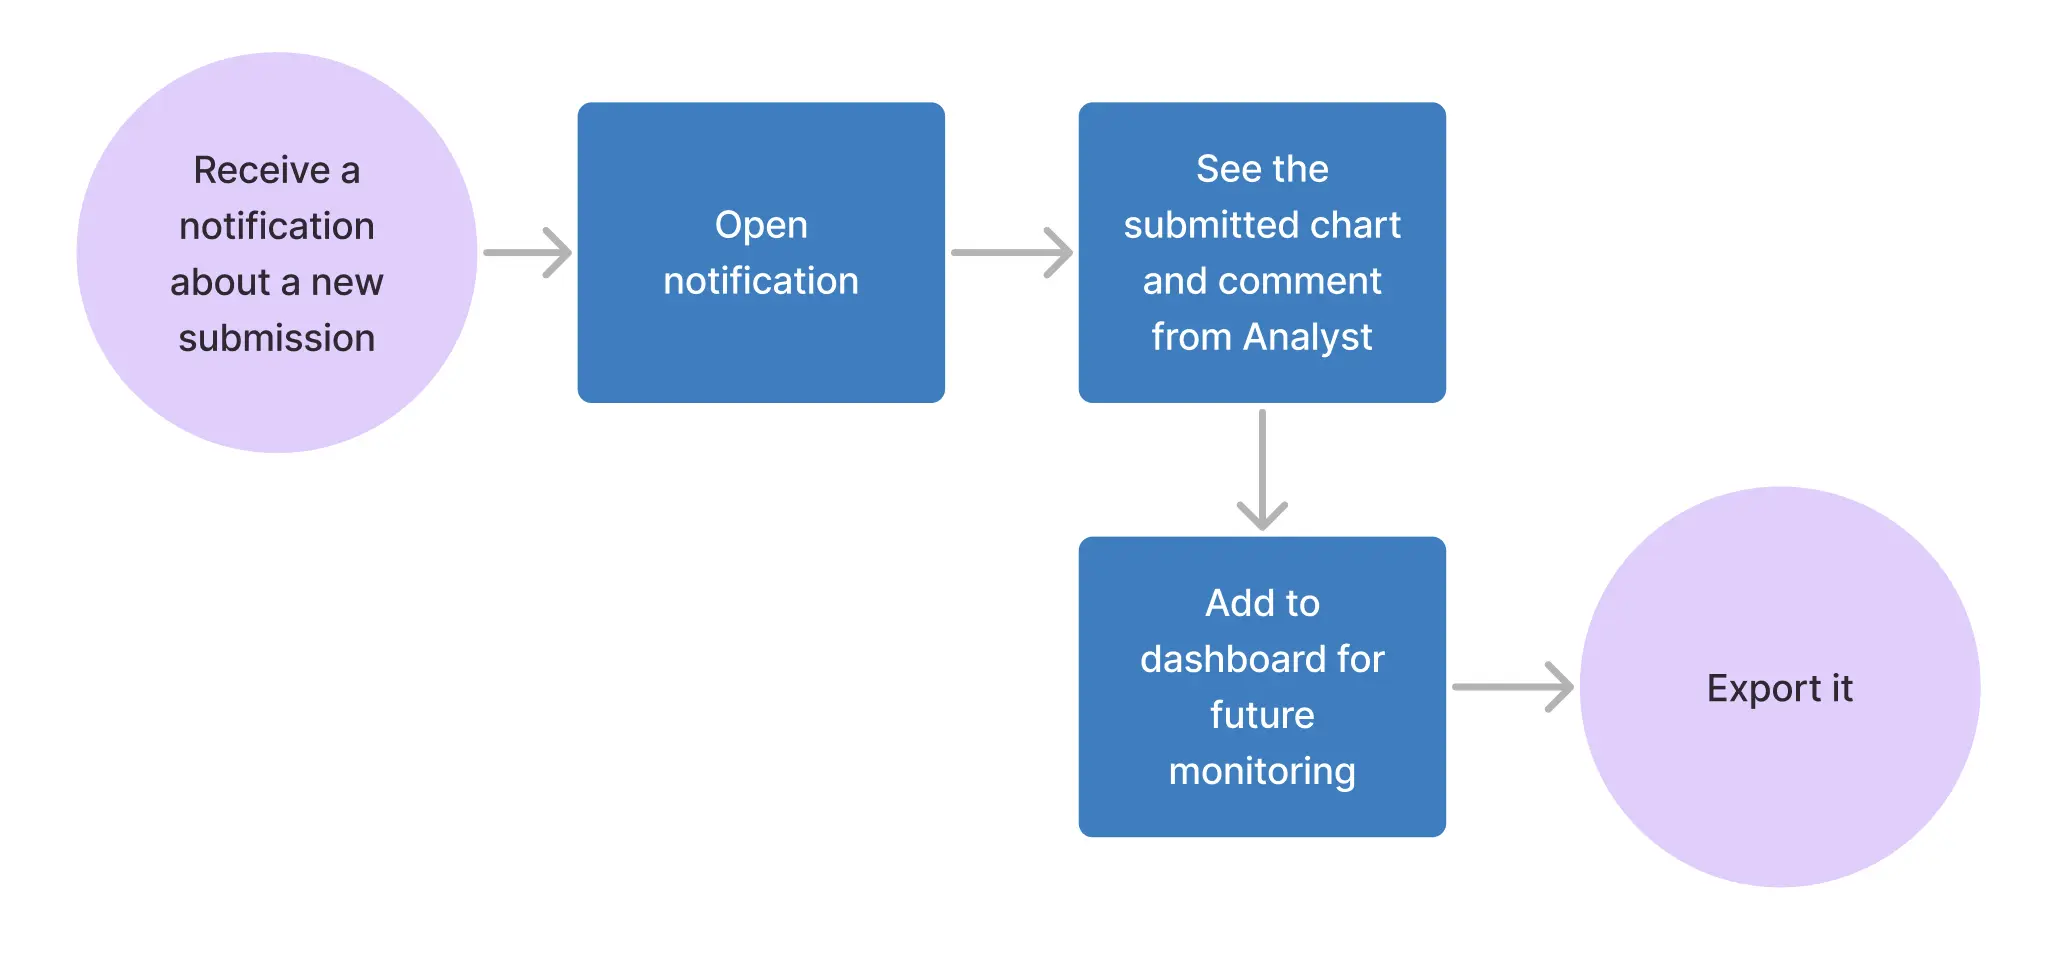
• Receive reports and analysis from the Analyst to inform strategic decisions.
• Collaborate with other departments to align business strategies.
• Receive reports and analysis from the Analyst to inform strategic decisions.
• Collaborate with other departments to align business strategies.
Challenges:
• Needs an easy-to-read overview of key performance metrics.
• Requires regular access to sales and inventory reports for decision-making.
• Values insights from the Analyst to inform strategic choices.
• Requires regular access to sales and inventory reports for decision-making.
• Values insights from the Analyst to inform strategic choices.
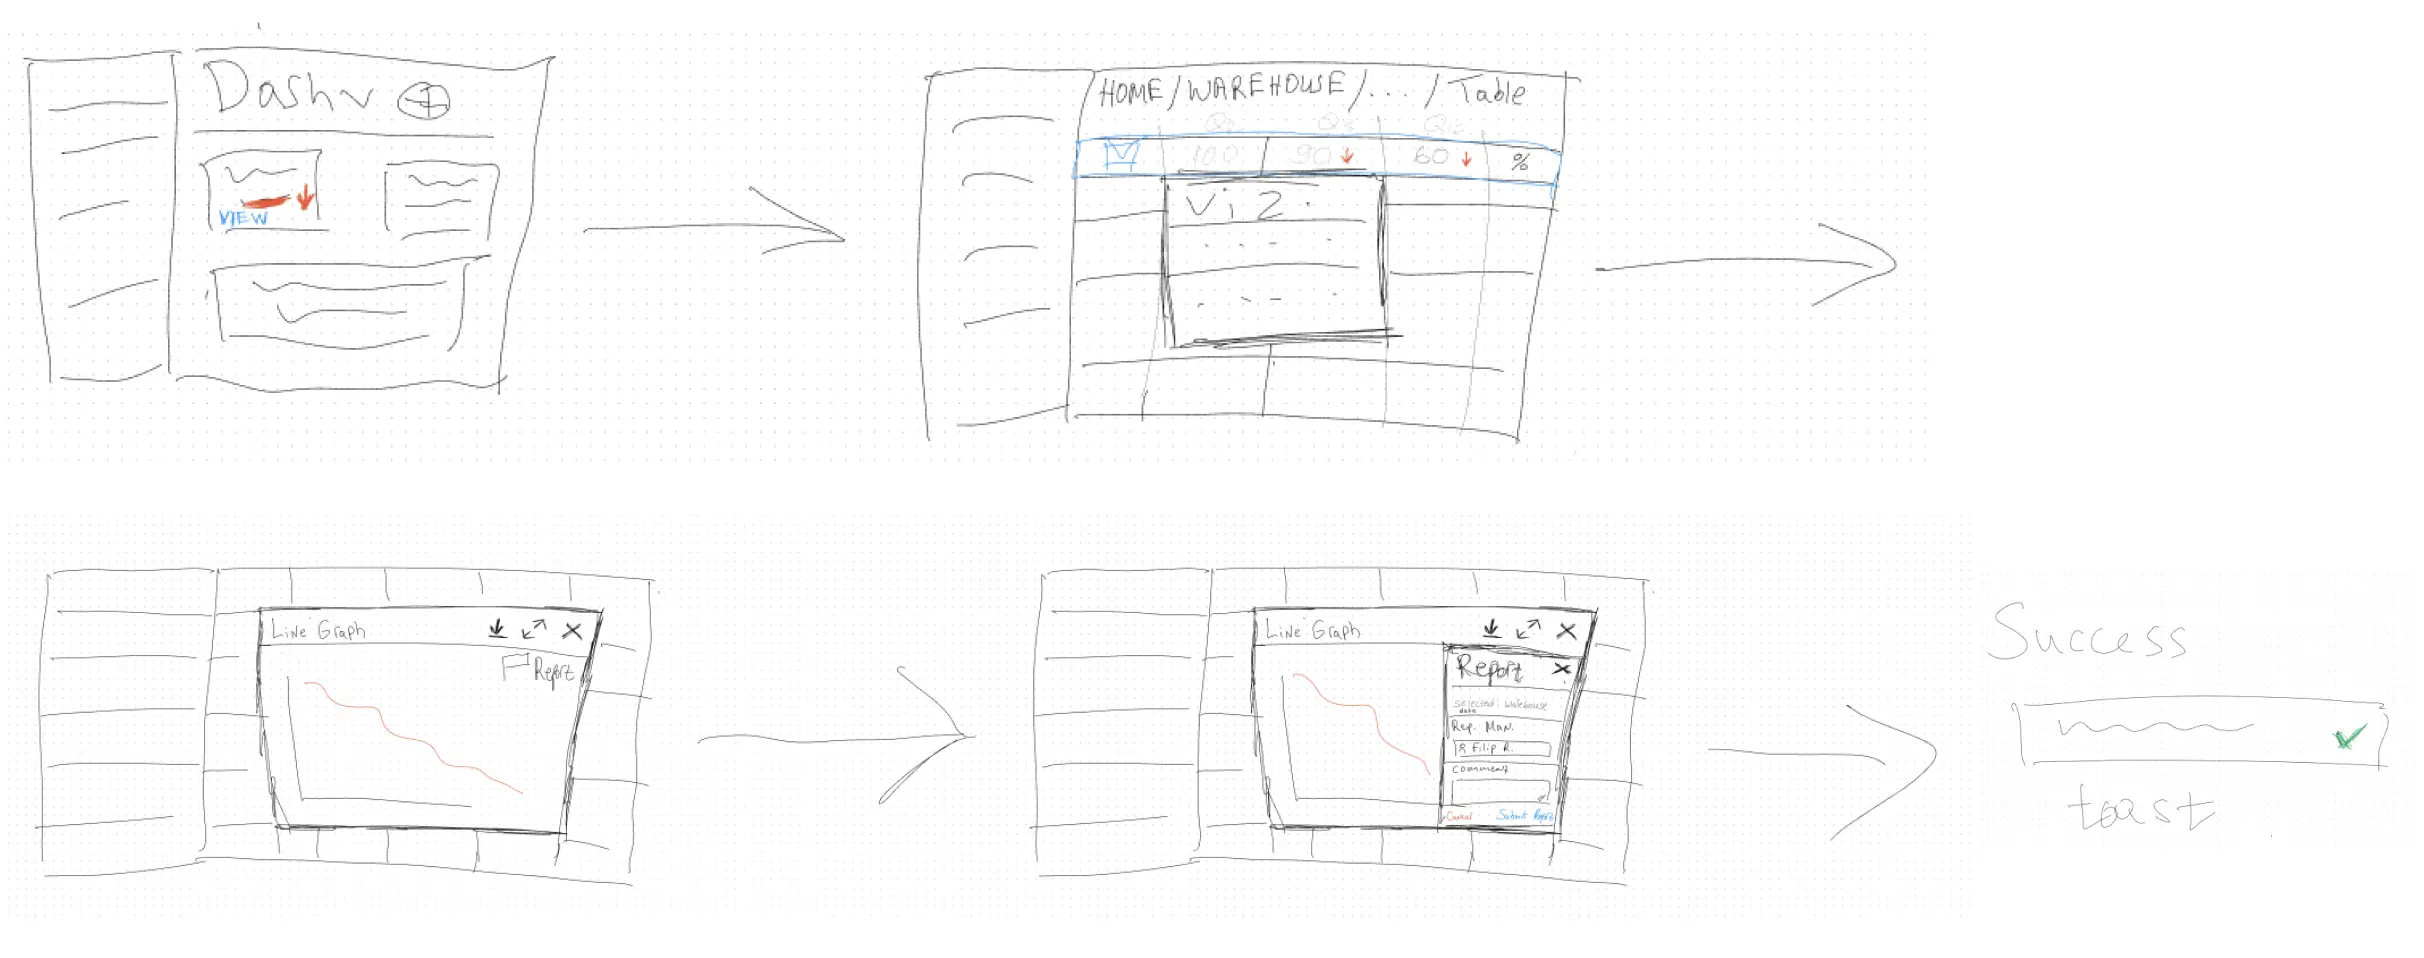
Wireframe Sketches
Outcome
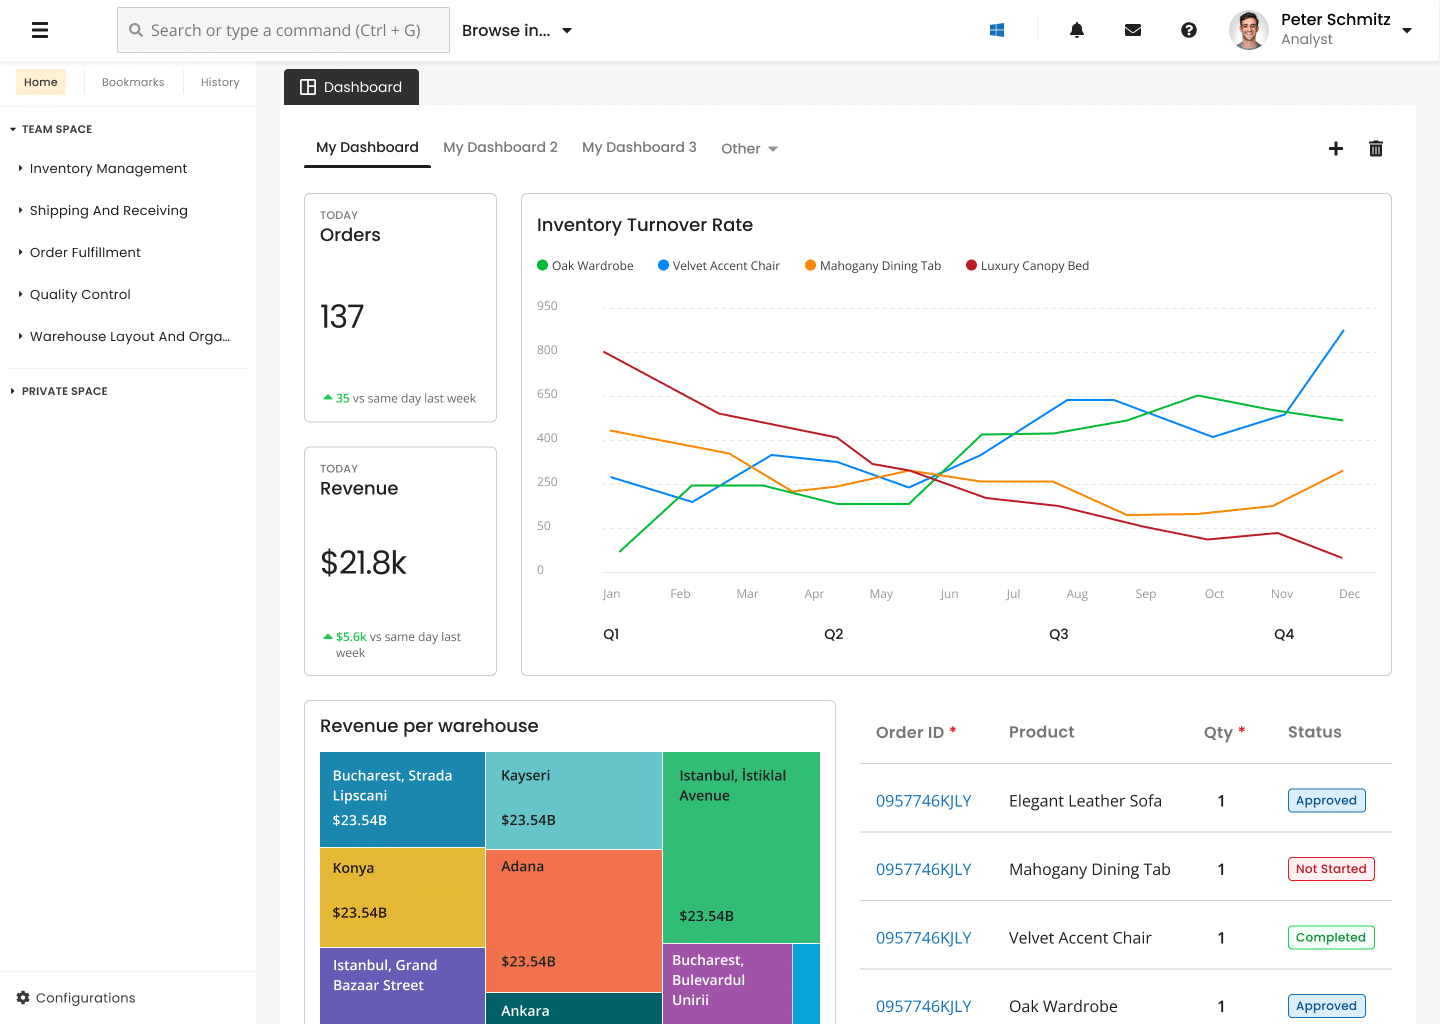
An Elegant, Simple Design for Complex Jobs
Our solution balanced a variety of complex tasks with an easy-to-use, yet flexible design.
Our focus was on creating different paths for users with different jobs, like Finance, CRM, and warehouse management. This way, everyone can use the system easily, no matter their role.
Our focus was on creating different paths for users with different jobs, like Finance, CRM, and warehouse management. This way, everyone can use the system easily, no matter their role.
Tailored for Every Role 👥
→ Revenue tracking
→ Budget management
→ Financial reporting
→ Budget management
→ Financial reporting
→ Customer management
→ Sales pipeline
→ Communication history
→ Sales pipeline
→ Communication history
→ Inventory tracking
→ Order fulfillment
→ Stock management
→ Order fulfillment
→ Stock management
Interface Preview 🎨
Simplicity
Intuitive interface that requires minimal training
Flexibility
Adapts to different roles and workflows seamlessly
Efficiency
Streamlined processes that save time and reduce errors
Experience the Design in Action
Explore the interactive mockups and experience the intuitive flows designed for different user roles. ✨
Analyst Flow
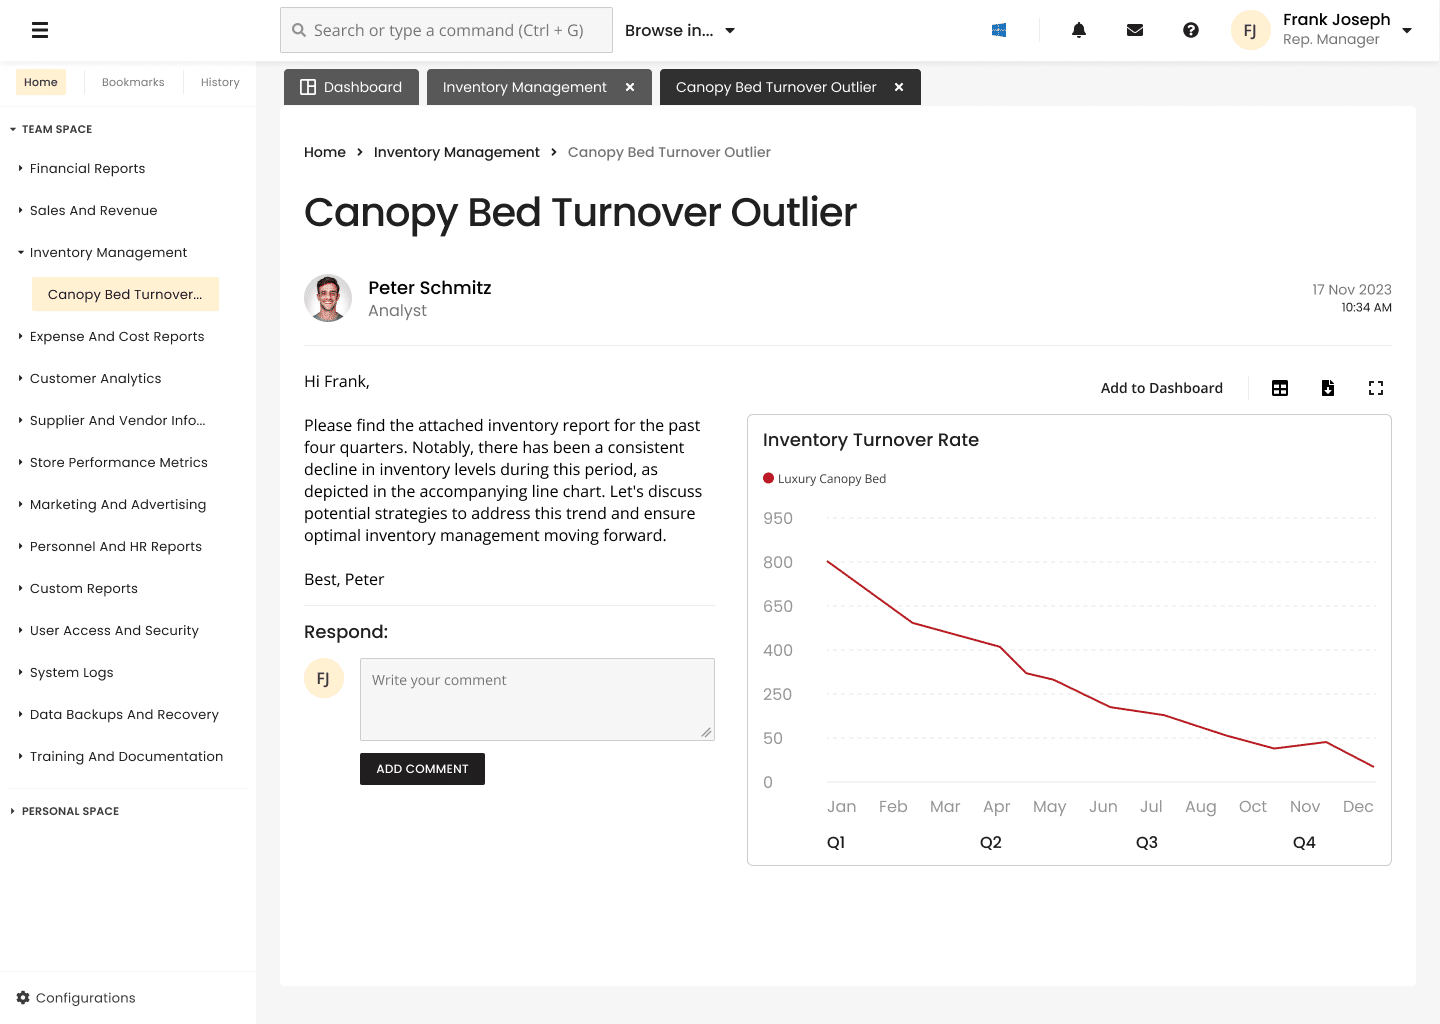
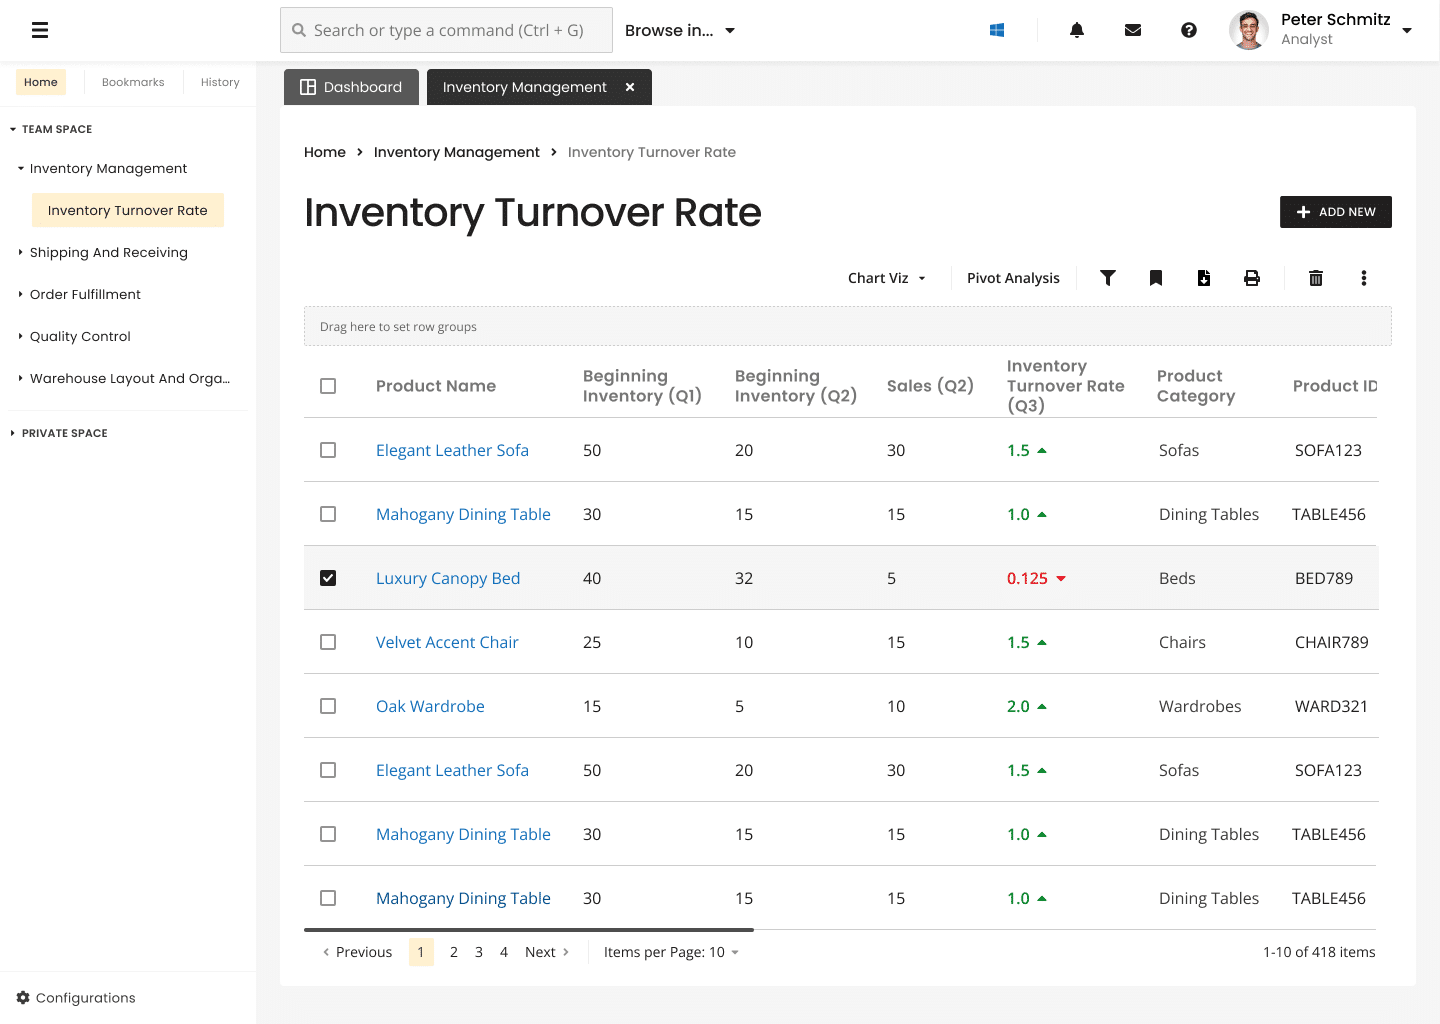
"As an Analyst, I want to review my personalized dashboard, identify anomalies in the data, and explore details by expanding widgets into tables. I need to visualize key insights as graphs and submit my findings with comments for review by the Reporting Manager."
Reporting Manager Flow
"As a Reporting Manager, I want to receive a notification when an Analyst submits a chart and comment, so I can review the data. I need to decide whether to add the insights to my dashboard for future monitoring or export them for reporting purposes."
Start a Project
Excited to get started? Click the button below to schedule a free consultation with me, where we will discuss your project!
Free consultation
